Understanding the Impact of Website Speed on Your Revenue
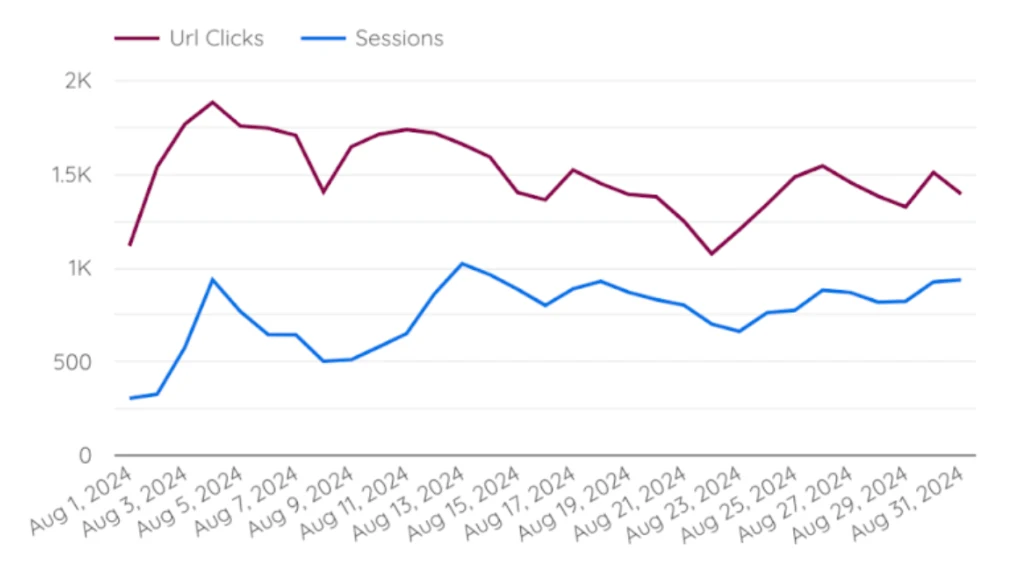
The performance of your website directly influences your bottom line. As illustrated in the graph below, found in the SEO > Overview section, a significant portion of clicks from Google search results are lost before they result in a site visit. This issue is also prevalent in paid advertising campaigns. Search engines like Google closely monitor these metrics, and a high bounce rate can negatively impact your SEO efforts.
Identifying the Problem
The first step in addressing this issue is to identify the root cause.
Before diving in, let’s clarify the concept of a “session” as defined by Google Analytics. In GA4, a session represents a user’s engagement with your website. Each time a user visits your site, a new session begins. If the user navigates to different pages, a new session is initiated.
Normally, the number of sessions (blue line) should exceed the number of clicks (red line). However, if the blue line falls below the red line or they intersect, it indicates a significant number of clicks are not converting into sessions, signaling a potential issue.
One common culprit is slow loading times. Users are impatient and often abandon a site if it takes too long to load.
Leveraging Core Web Vitals
- SPEED > Origin Level
To pinpoint the exact cause of slow load times, let’s explore Core Web Vitals. Navigate to SPEED > Origin-Level. The graphs here display crucial metrics that impact your site’s loading speed. While Google collects this data and presents it in PageSpeed Insights, our dashboard provides a more granular view of your specific pages.

If the line representing the 75th percentile falls within the green zone, your site’s performance is excellent. Yellow indicates areas for improvement, and red signifies critical issues that require immediate attention. In the example above, all metrics except FID require optimization. We’ll delve deeper into the technical aspects of these metrics later.
Tracking Core Web Vitals Over Time
PageSpeed Insights typically provides data for the past month. However, your site’s performance might have fluctuated over time. Our dashboard allows you to analyze Core Web Vitals over a six-month period.
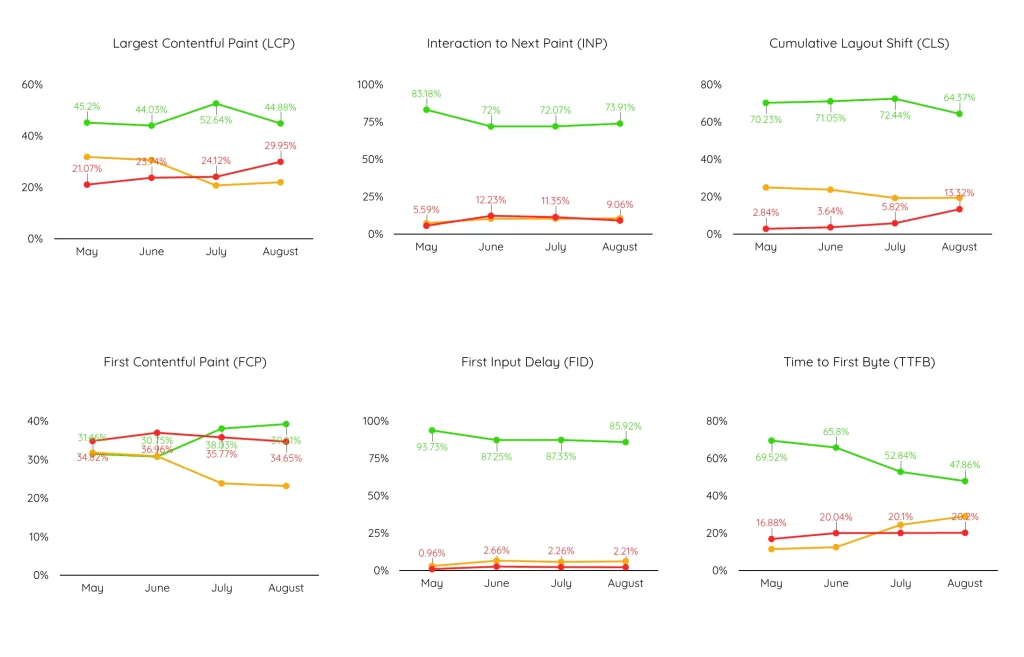
By monitoring these trends, you can prioritize optimization efforts based on historical data.
You can customize the timeframe by selecting a specific month from the “Date” menu. Additionally, you can view data for mobile or desktop devices.

Drilling Down to the Page Level
- SPEED > Page Level
To identify the specific pages causing performance issues, navigate to SPEED > Page-Level. This section provides a detailed breakdown of each page’s performance score, speed index, and other relevant metrics.
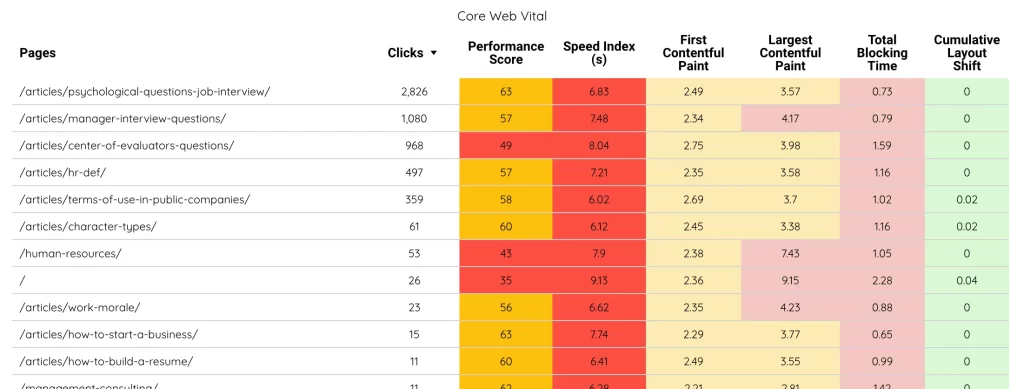
You can easily pinpoint underperforming pages and prioritize optimization efforts based on factors such as traffic and importance.
Additional Considerations
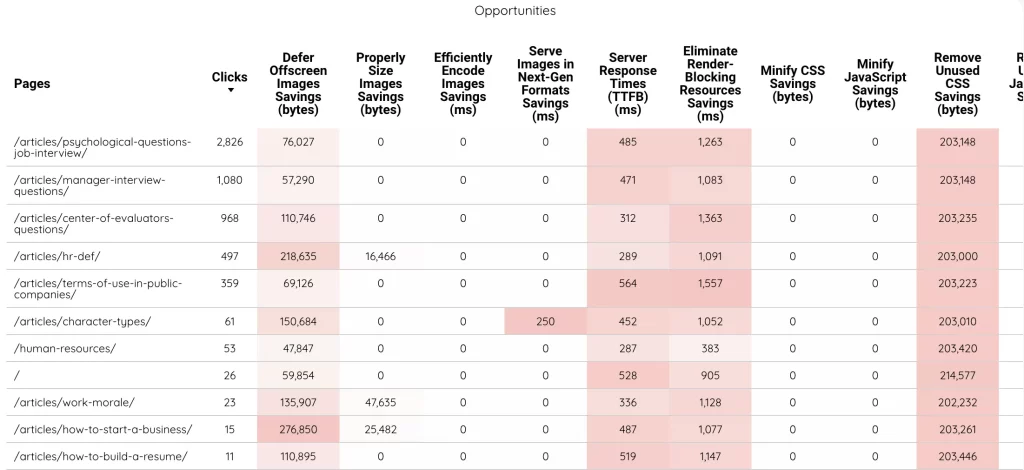
While these metrics provide valuable insights, it’s essential to consider other factors that can impact website speed, such as server configuration, code quality, and third-party scripts.
Actionable Steps
- Prioritize Optimization: Focus on pages with the lowest performance scores and highest traffic.
- Use PageSpeed Insights: For a more detailed analysis of individual pages, use Google’s PageSpeed Insights.
- Address Core Web Vitals: Improve metrics like LCP, FID, and CLS.
- Minimize HTTP Requests: Combine and minify files to reduce the number of requests to the server.
- Optimize Images: Compress images without sacrificing quality.
- Leverage Browser Caching: Store static assets locally to reduce server load.
Remember: A faster website not only improves user experience but also boosts your search engine rankings and overall online success.
Accessing Page-Level Performance Data
By default, not all pages are analyzed. You’ll need to submit a list of specific URLs to enable detailed analysis within the dashboard.
Here’s how to do it:
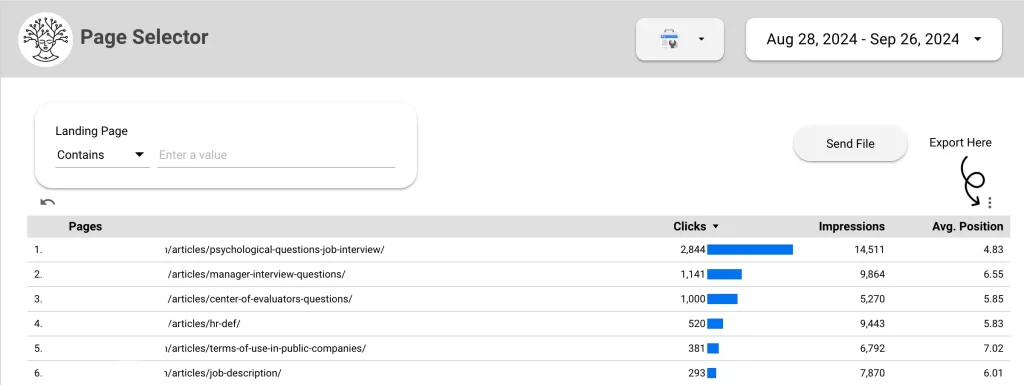
- Identify Key Pages: Use the Page Selector tool to identify your most important pages.
- Export Page List: Export the list in Excel or CSV format.
- Submit Page List: Use the “Get Pages” form to upload the list to the database.
Note: The analysis process may take up to 24 hours. However, you can prioritize this process by contacting our support team.
Data Privacy and Security
Rest assured that your data privacy is our top priority. When submitting the page list, you only need to provide the URLs. Any additional data can be removed. The analyzed data is accessible only after you’ve linked your Search Console account to the dashboard. This ensures that data for multiple websites remains separate.
Limitations and Pricing
Please note that there are limitations to the number of pages that can be analyzed, as each analysis incurs a cost.
- Free Trial: Up to 10 pages
- Standard Plans: 100 pages
- Exclusive & Enterprise Plan: 300 pages
- Additional 100 pages: €90 (annual fee)
Important Considerations
While the dashboard provides valuable insights into your website’s performance, it’s important to understand that the data is not updated in real-time. It’s designed for monthly analysis and trend identification. For immediate feedback on optimization efforts, use tools like PageSpeed Insights.
However, the dashboard remains a powerful tool for identifying problem pages and prioritizing optimization efforts.
By following these guidelines and leveraging the insights provided by our dashboard, you can significantly improve your website’s performance and drive better results.